Microsoft 365 Usage Reports Dashboard – Power BI
In this post, we will go through the steps involved in creating the dashboard for the Microsoft 365 usage reports using Power BI. One of the tasks of the Microsoft 365 administrator is to share the usage reports to the stakeholders regularly for them to analyze cloud adoption, service usages and plan budgets, licensing, and much more. So, this report is critical for them, and the expectation is to provide it in a simpler way rather than large number of data & information. To achieve this, we can make use of Power BI which is effective data visualization tool that helps in translating the information into visual context.
Microsoft 365 usage reports includes Active users, Exchange, Teams, One Drive, Share point, activations and much more. These reports are available for the last 7 days till last 180 days and the reports may be available within 48 hours. Providing these data on an individual service based would be complex and hard to remember. Hence, we can use the Power BI tool to create a dashboard with all the data extracted from the usage reports.
We will now the steps involved in presenting the M365 usage reports using Power BI.
- Login to Microsoft365 admin centre -> Reports -> Usage -> scroll to the bottom and select “Microsoft 365 usage analytics”
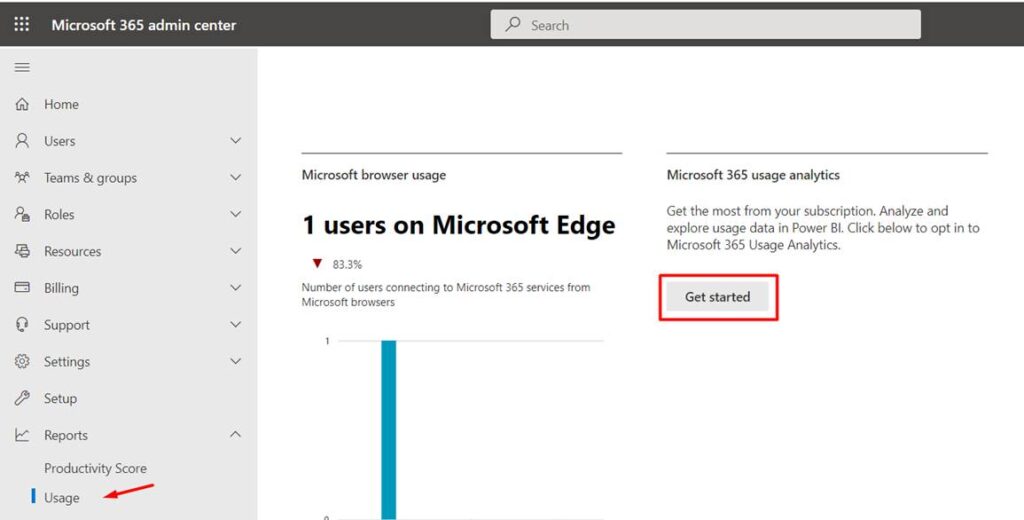
- Click on “Get Started” -> Enable the Power BI for usage analytics and save it
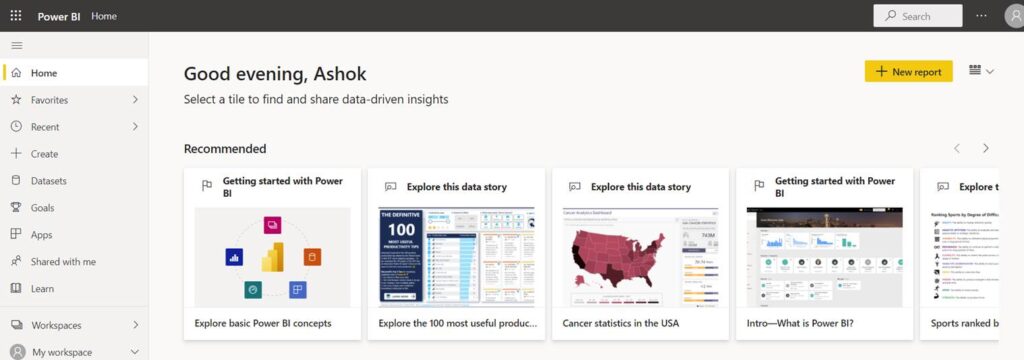
- Once the report is ready, click on “Go to Power BI”. It will login to the Power BI portal
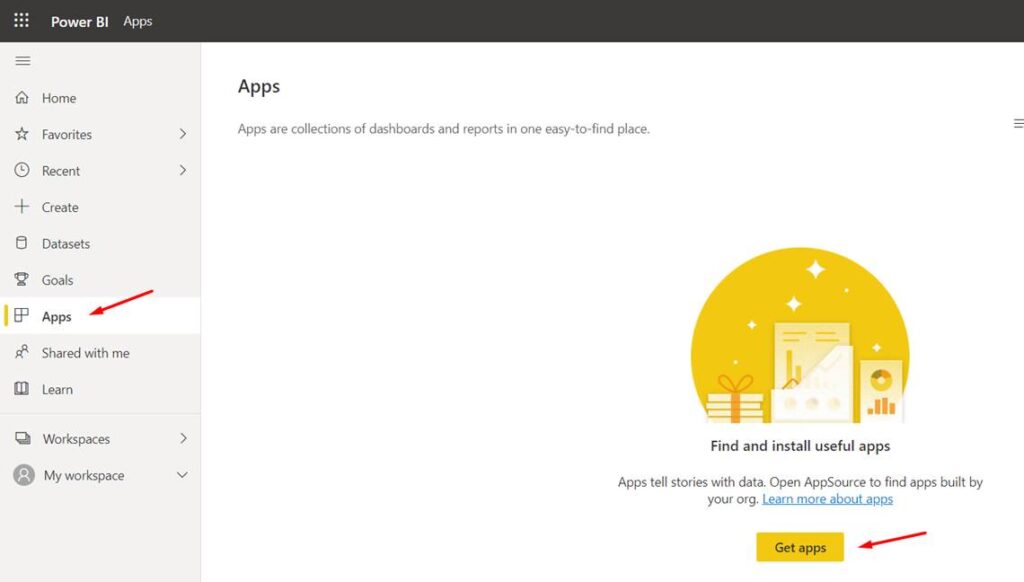
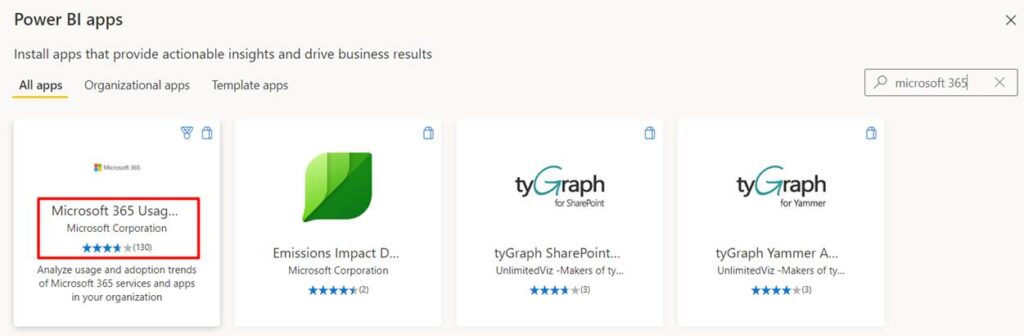
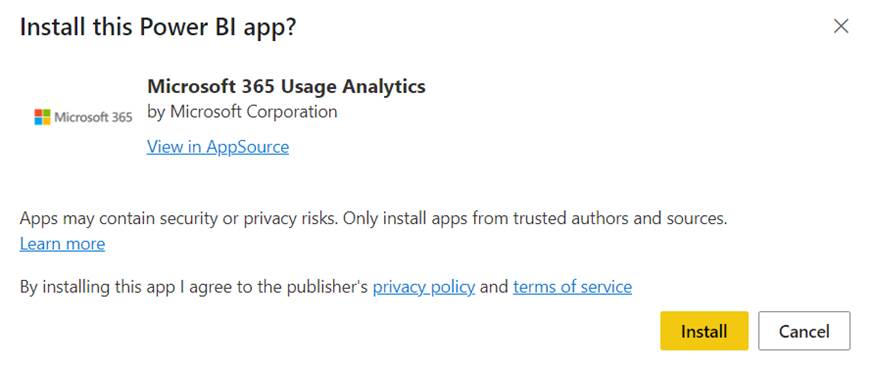
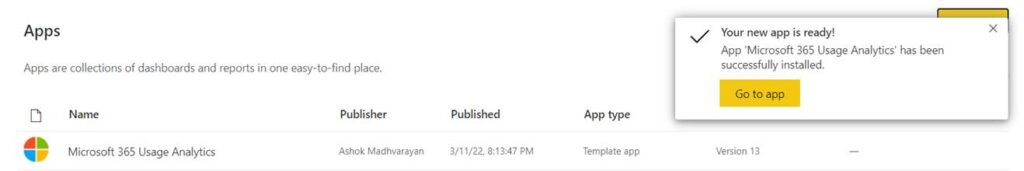
- First you must install the “Microsoft 365 Usage Analytics” app using the below steps
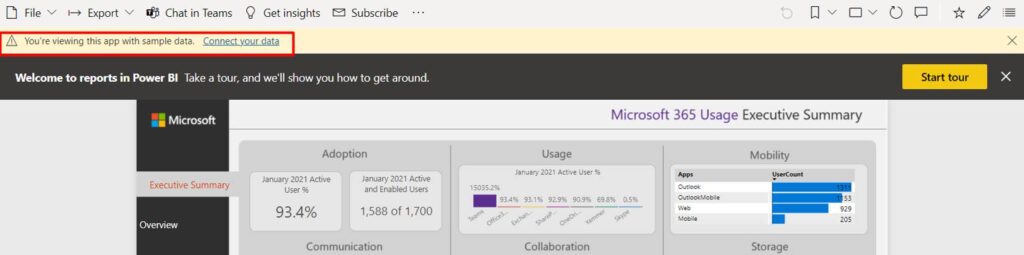
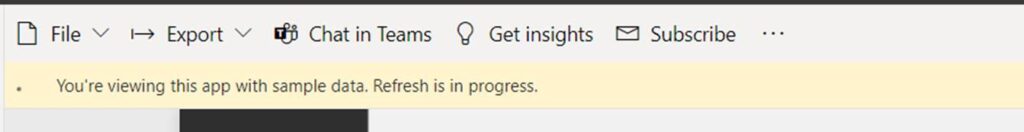
- Once you click on the app, it will provide the dashboard with the sample data. To get your dashboard, click on “connect your data”
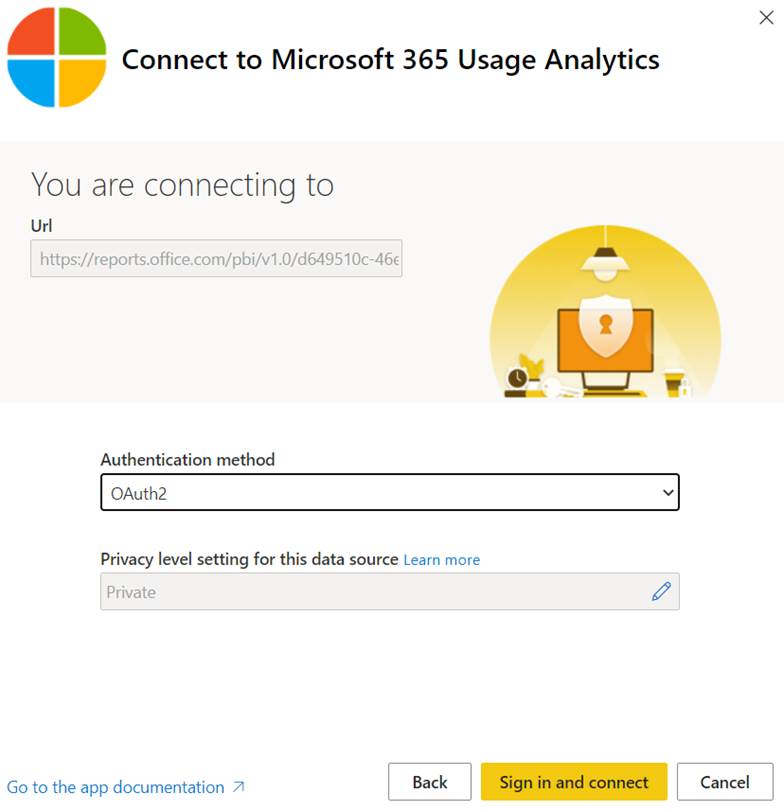
- Provide your tenant ID. You can follow the steps mentioned here to get the tenant ID
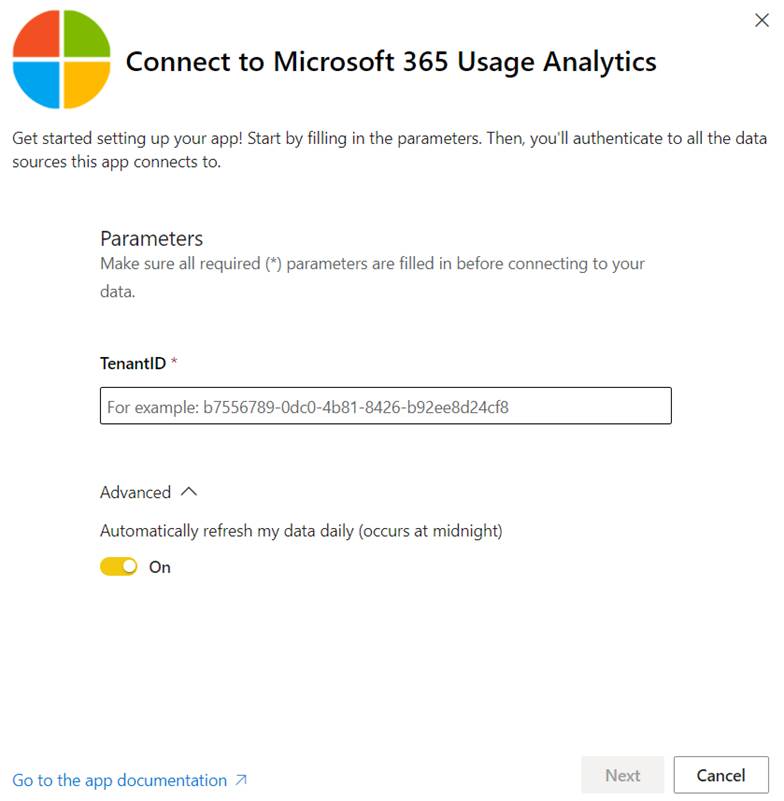
- Select the authentication as “OAuth2” and click on “Sign in and Connect”
- Once the credentials are validated, it will connect, and the dashboard will be refreshed with your tenant Microsoft 365 usage data
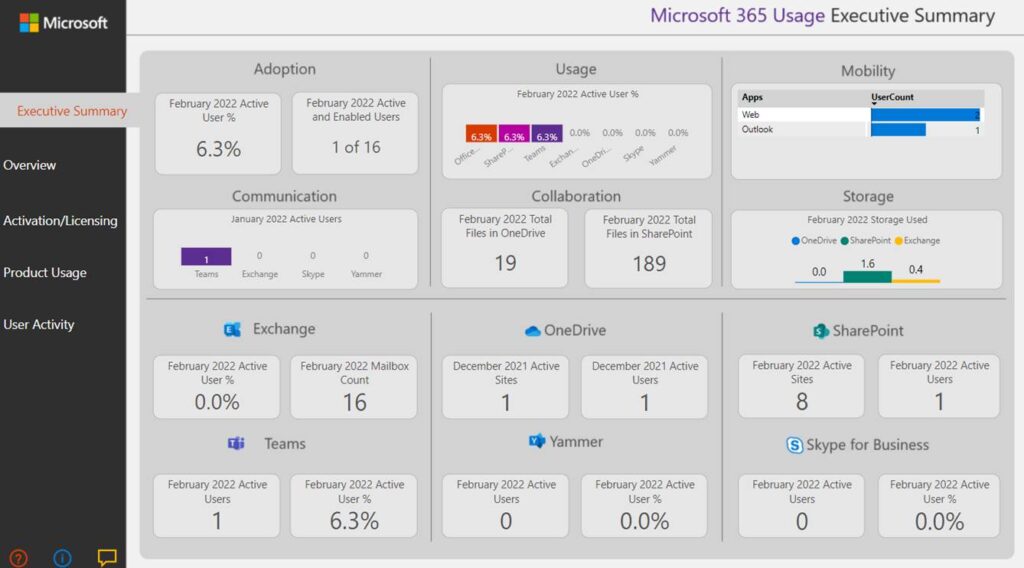
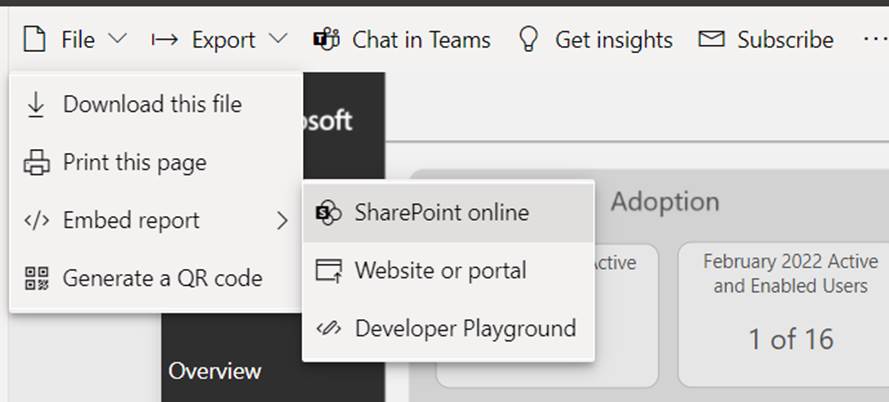
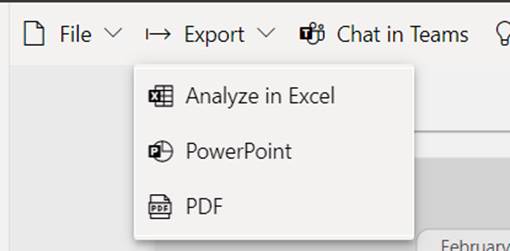
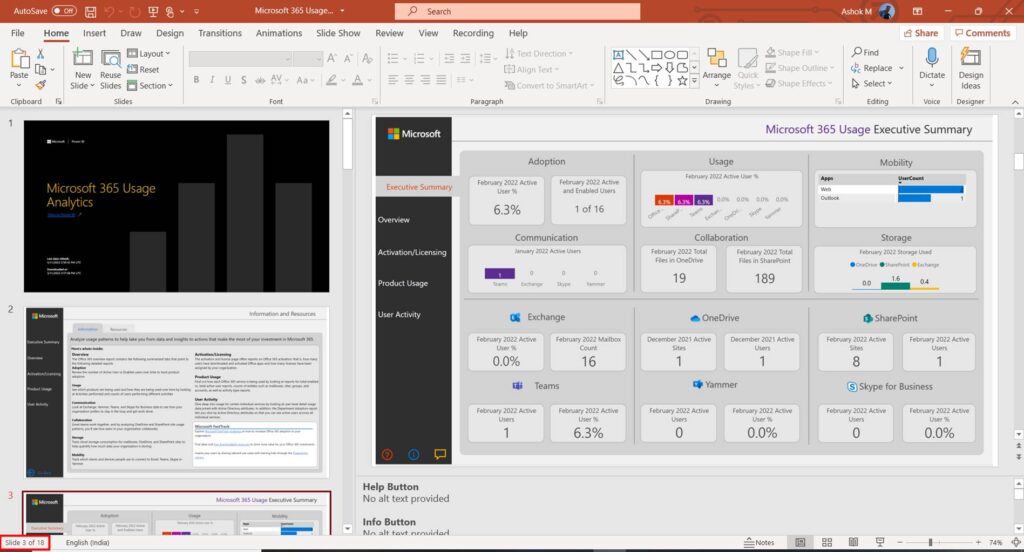
That’s great. You have now created a Power BI dashboard for the Microsoft 365 usage reports. You can export it to a presentation, PDF or you can also publish this in SharePoint Online page. I have downloaded the presentation which has 18 slides. You can remove the user activity and keep the required things like Executive summary, overview, etc based on your needs and present it to the stakesholders.
Happy learning!! 😊